Eggplant AI Home Page
The Eggplant AI Home page provides a dashboard where you can review the summary of your modeling and test execution activity. The following widgets make up the Home page:
Click the Home button on the main Eggplant AI UI to access the Home page. Use the model selector drop-down list at the top of the page to switch the summary view to another model.

Model
The Model widget displays a donut chart that shows the number of actions present in the selected model, as well as which of those actions have snippets attached (also known as Automated in the widget).

The table below the chart provides an overview of how many of your actions and states have snippets attached. This information can help you determine how much more work is required to fully connect the model to Eggplant Functional. Click anywhere on the widget to return to the Eggplant AI UI and load the current model. See Working with Models for more information on using models in Eggplant AI.
Coverage
The Coverage widget displays a bar chart that shows a comparison of all coverage types in a model, along with the coverage percentage for the available coverage types. Click anywhere on the widget to switch to the Coverage Report in Insights.

Run Report
The Run Report widget displays a donut chart that represents the results of test runs for the selected model. When you hover your mouse over the chart, a tooltip displays the number of runs that passed, failed, or were incomplete.

The Run Report widget provides the following information:
Pass: The total number of passed test runs.
Fail: The total number of failed test runs.
Incomplete: The total number of incomplete test runs.
Runs: The number of test runs from the most recent version of the model from the database.
Duration: The total time taken for the test runs to complete.
Pass rate%: The overall passing percentage for the test runs.
Bug Hunting
The Bug Hunting widget displays the top three failed actions and tags that caused the selected model to fail. Note that the failure data is available only if either an action or an associated tag in your model failed during a test run.
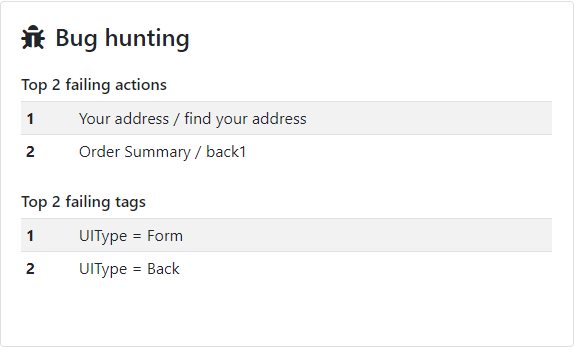
See Using Tags to learn more about how tags can be useful during debugging. Click anywhere on the widget to navigate to the full Bug Hunting report in Insights.
Test Cases
The Test Cases widget displays a donut chart that represents the total number of passed test cases versus the test cases that have not been run from the selected model. Click anywhere on the widget to navigate to the Test Cases Insights page. When you hover your mouse over the chart, a tooltip displays the number of test cases that have passed or haven’t run yet.
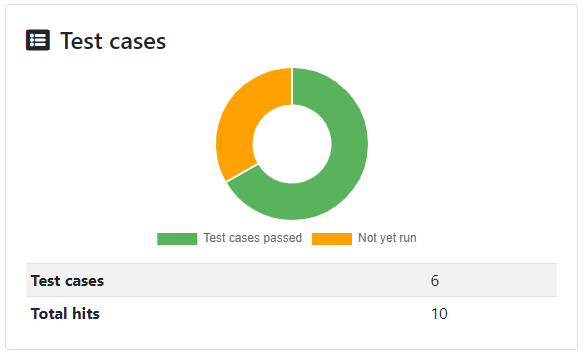
The Test Cases widget provides the summary of:
Test cases passed: Indicates the number of test cases that passed out of the total number of test executions.
Not yet run: Indicates the number of test cases that have not been run yet.
Test cases: Displays the total number of test cases available in the model.
Total hits: Displays the number of times test cases have been hit during the model execution. Test case hits are represented by test ID numbers for every instance of a model run where the test case definition was matched.
![]() Eggplantsoftware.com | Documentation Home | User Forums | Support | Copyright © 2022 Eggplant
Eggplantsoftware.com | Documentation Home | User Forums | Support | Copyright © 2022 Eggplant